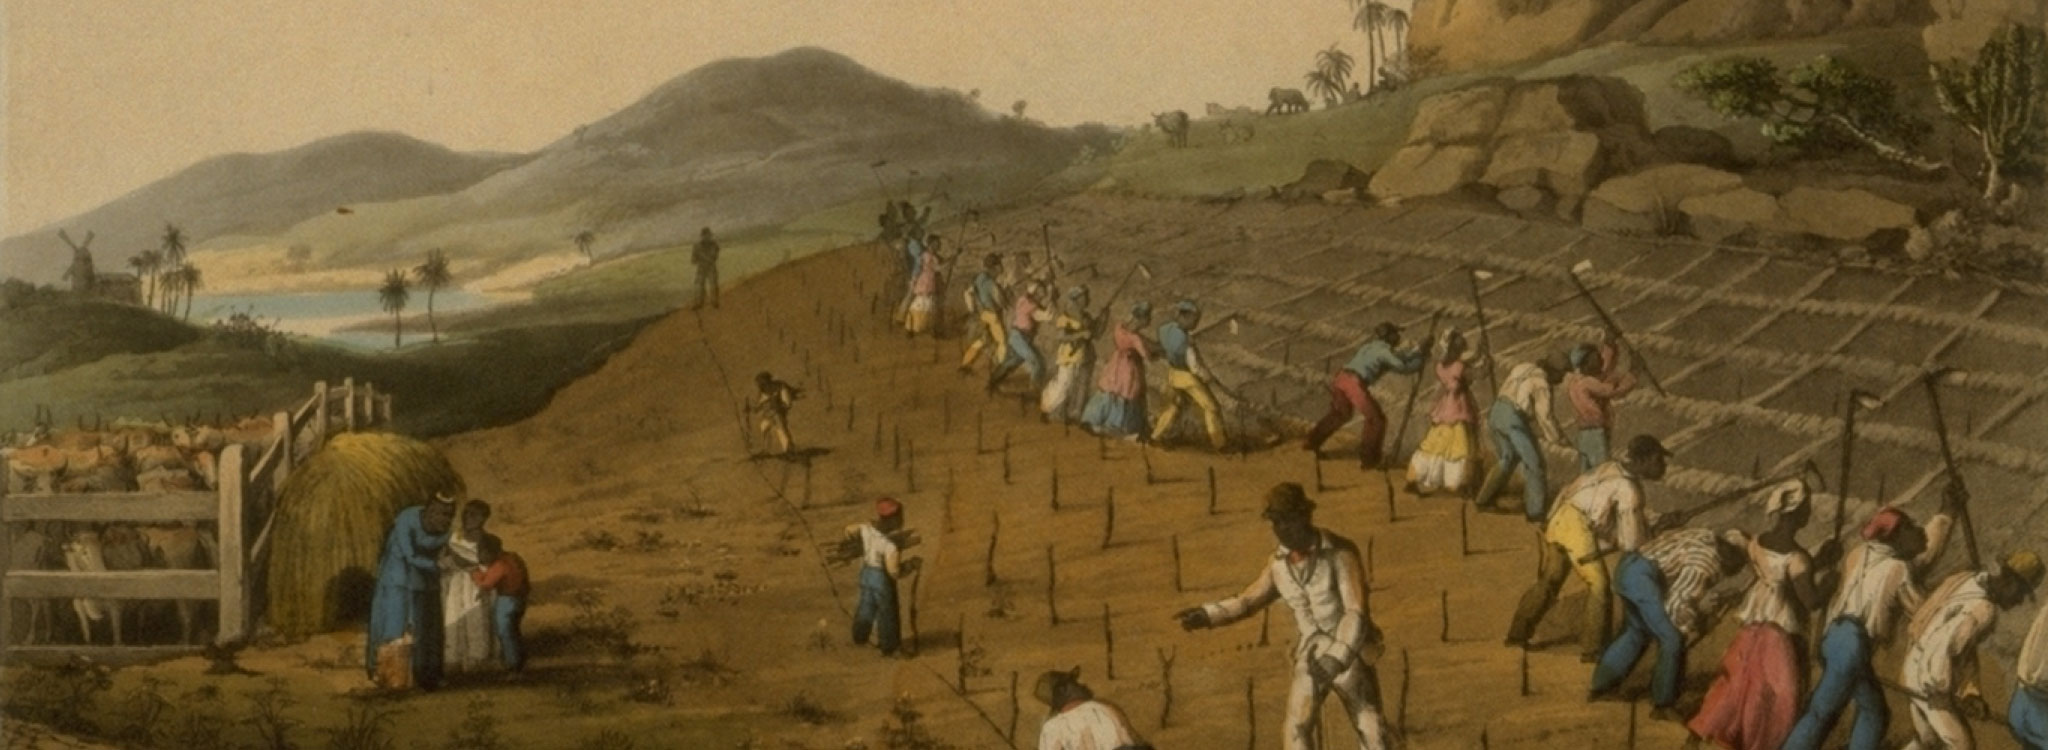
Generate visualizations such as interactive maps, graphs, and timelines to view broad time periods and geographical areas as well as to pinpoint specific data about voyages and origins of the enslaved. These tools can help to contextualize the data accessible via the Enslaved Hub and also generate new representations of the experiences of individuals who were part of the historic Atlantic slave trade.